–https://twitter.com/PrimeTrading_/status/1555893722621087745
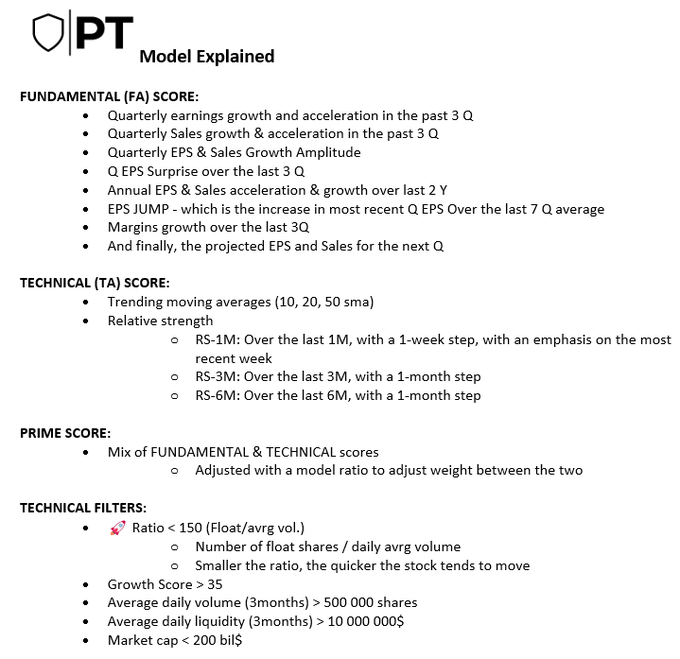
1. Building the UniverseList
The first step for me is to build what I call my UniverseList. This list contains the stocks that fit the fundamental & technical criteria that I want to see on every stock that I trade.
Once that big list is built, it becomes my sandbox in which I will then continue to drill down to find the STRONGEST stocks. Because even if a stock has stellar fundamentals, if its chart does not fit my template and it does not lead, I don’t even want to consider it.
2. Building the WatchList
Once the whole US market is drilled down to the 500 best names, I want to ONLY focus on the technicals at this point. I have 2 different ways to approach that step:
3. Building the FocusList
Once I have this shortlisted list of strongest names, I want to find tactical entries on which I can enter with a risk-reward.
I have developed a playbook of a couple of technical setups that I use to trade the market, you might have already seen this article about these, but if not you kind find these here: https://primetrading.substack.com/p/alexs-technical-setups-playbook-?r=mst4k&s=w&utm_campaign=post&utm_medium=web
4. EXECUTING the FocusList
Once that short FocusList is built, I put alerts on the levels I consider buying each stock. I do that in TradingView as well. Then, it’s really about executing my system. Here are a couple of articles I wrote that will explain in way more detail:
Entries & Position management ⚙️
To make this article more “hands on” I’ll use a recent trade I took in 2022 as an example to explain each steps of a trade management system.
The stock I’ll use as an example is NEX – NexTier Oilfield Solutions inc. (were you expecting anything else than an Oil play this year)
Also, consider that what I’m explaining here is my system, there is thousands way to trade and these rules might not suits you. You can however use it as a guideline to get inspired and develop your own system with your own rules.
Focuslist with Setups
First thing is to have a setup playbook. You have to know that these technical setups have an edge in the market and that over time they will have a positive expectancy.
There is many technical setups that have an edge in the market and I won’t tell you that mine are the best or the only ones working, it’s false. The important is that you have to find what is working for YOU and you build this playbook that you’ll use and focus on. FOCUS ON is important here… being a Jack of all trade is not the best idea in trading, you want to start with 1 or 2 setups that you’ll really master before adding anything else to your playbook.
Once you know what you’re looking for, you have to build a Focuslist each night (or week if you trade longer term) that includes the names that are near triggering the setups that are in your playbook. This will be the short list (5-10 names max) that you will focus on once the bell rings at 9:30 (EST).
NEX came on my radar after an impressive 75% move in less than a month during an important market weakness period and breaking out of his base with an impressive 26% move in 3 days from the 21dma retest. You don’t want to buy when you’re than much extended… I want to wait for the lower risk entry after a pullback to the 10 or 21dma after the breakout. This indicates that the breakout is holding and no more sellers is coming to the market.

Entry Tactics
In this case, once I got 2 daily highs to work with, I draw my down trend line (DTL) from these 2 highs and that forms the DTL that I want to work with to enter the trade. A breakout of that DTL is indicative of a continuation.
With NEX, we had 5 consecutive days of tight action right under that DTL and being squeezed by the 10dma. That’s the kind of action you want to see before a breakout. Selling pressure is out, so once the buyers come back, the path of least resistance is up.
Note: I always use a full position at my entry, I do not “scale-in” into my entries.
I have 3 tactics to enter on that DTL breakout:
1- Entry on the DTL breakout
First, I put an alert in my charting platform TradingView directly on the DTL that trig once the price crosses it. When I get that alert of the line breakout, I can enter the trade directly if I have a high conviction in the name and if the volume is there on the breakout.

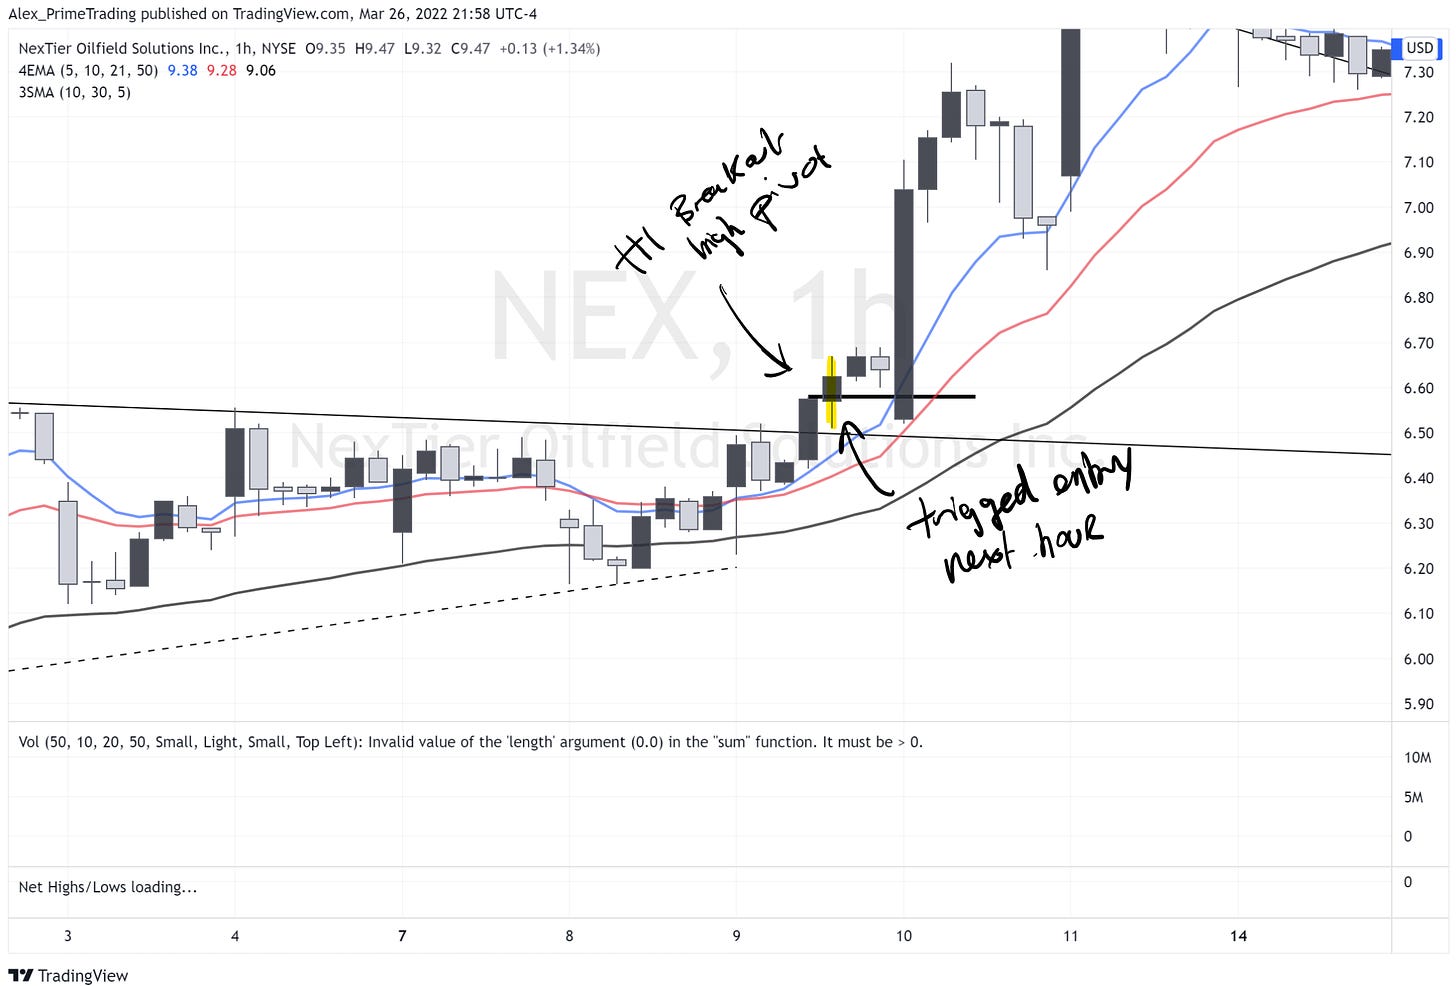
2- Entry on the H1 high breakout
When I want to be more conservative, I wait for the first hour breakout candle to close, and use the high of that candle as my entry level. This way, you have less chance to being caught in a false breakout of the wedge DTL (I’m sure you know too well about those, specially in 2021)
I enter the trade on the breakout of the H1 breakout candle close.
3- Entry on the pivot high (gap up & wick play)
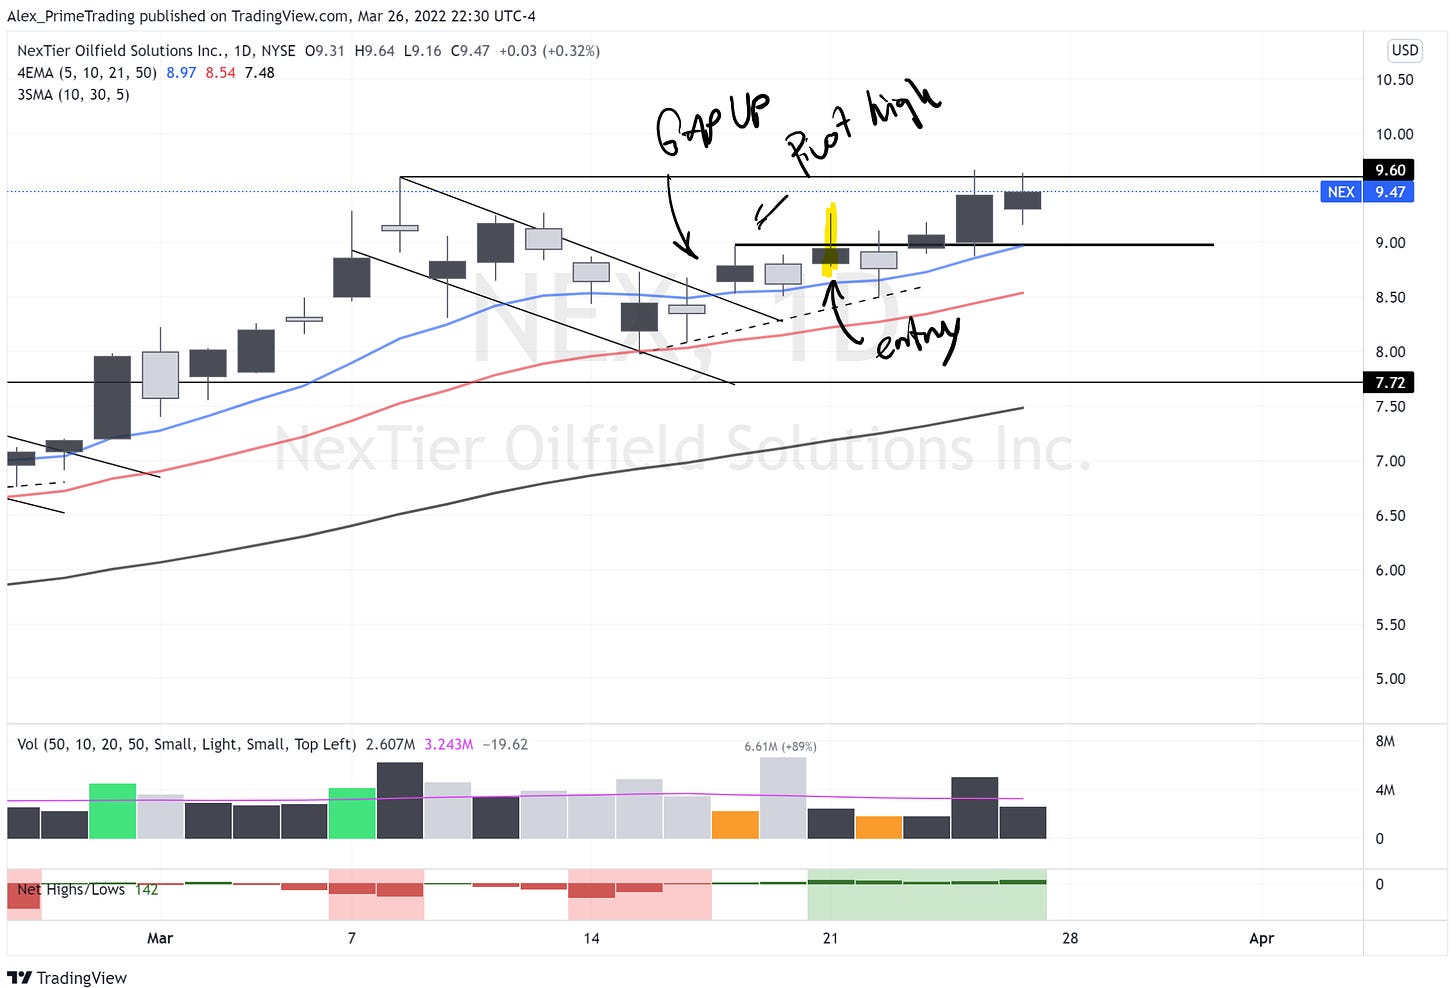
Now for the 3rd tactic, I’ll use a more recent setup in NEX. It often happen that you don’t get a chance to trade the direct wedge DTL breakout because the stock open with a gap up right out of that wedge already.
When this happen, I use the high of that breakout gap up candle as my entry pivot. Now you’ll say that this pivot breakout didn’t work as it came right back in and went back to the the 10dma the day after. Well… that’s trading! Entry levels or setups don’t work every time and that’s why you have to manage risk. If someone is selling you a system with a 100% win rate, run the fastest you can, it’s a scam.
We’ll use that example again later for the early violation section
Initial StopLoss
Stop Loss (SL) level/order is essential in having success in trading. (More in a future Article).
You might want to use hard stop (automatic order with your broker) or a soft stop (only alert in charting software)
You want to put your SL at a level that will limit your maximum risk in case of setup failure (trust me they will fail), but also giving enough room for perfectly normal market movements.
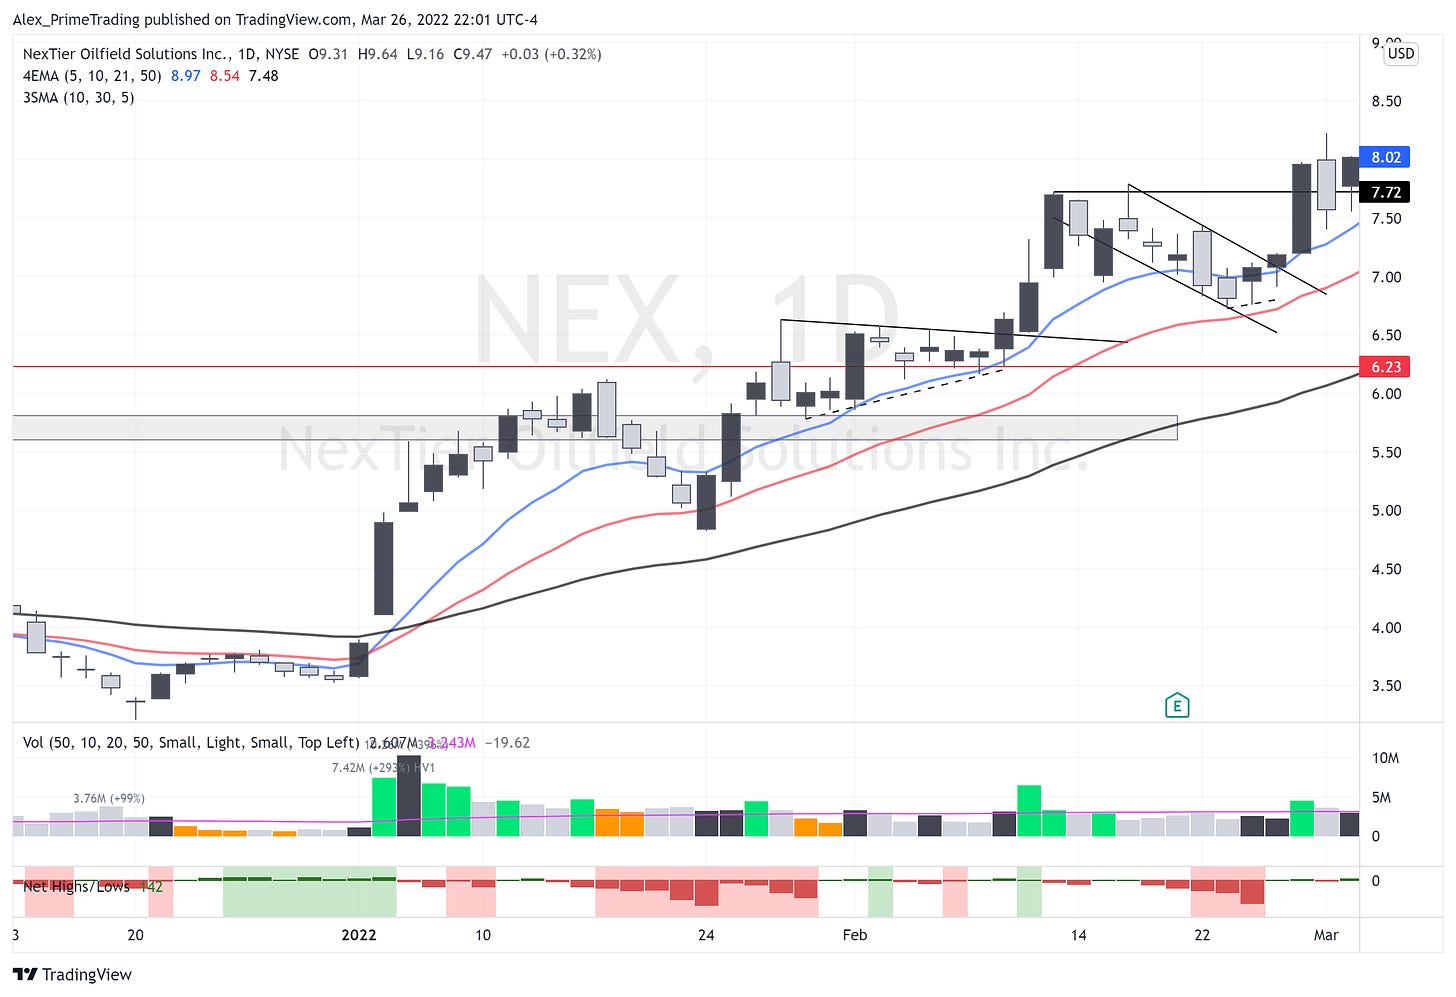
For that reason, one level that I found to work really well through the years is the Low Of Day (LOD). Meaning that you put your SL at the low of the breakout daily candle.
In that case, notice the red line @ 6.23 where I put my SL once I entered on the wedge breakout. If price comes below that price, you know that something is not right with the price structure not being respected.
In that case you want to cut your position immediately without questions. The more you wait and hope the price will come back, the harder it will get to actually cut the trade. If you struggle with that, use hard stop with your broker.
Early Violations
As I said, not every entry will work. You’ll notice that sometimes they try to breakout a stock only to sell into that strength. In that case, the price will come right back to your entry or below. You have to anticipate that scenario that happens quite often, specially in the last year or so during bad market environment.
When you enter the stock you have to look for these early cues:
1- Price breakout powerfully, then pullback slowly to the pivot level
- In that case, watch for a simple retest of the level, and continuation upward. Could simply be an intraday BORS setup.
2- Price breakout and they are selling it hard BUT without taking out LOD
- In that case, I want to give the stock some time below the entry level to see if it was only a shakeout. I keep the position intraday (if SL not hit), but if price did not come back above pivot at the end of the day, I close the position.
3- Price breakout and they are selling it hard even below LOD
- In that case I sell the position right away without asking question.
With scenarios 2 & 3, you want to always reset your pivot alert in case in was a false breakout due to a bad general market day and they try to breakout the stock again the day after. I missed too much opportunities by removing the stock from FL only to see it rocket higher the following day.

Selling Strength
These 2 last sections are really where you have to make it your own, test some things that speaks to you and develop a methodology that resonates with you. What I’ll lay down here is what I feel more comfortable as a trader, and might changes based on my performance & current market condition.
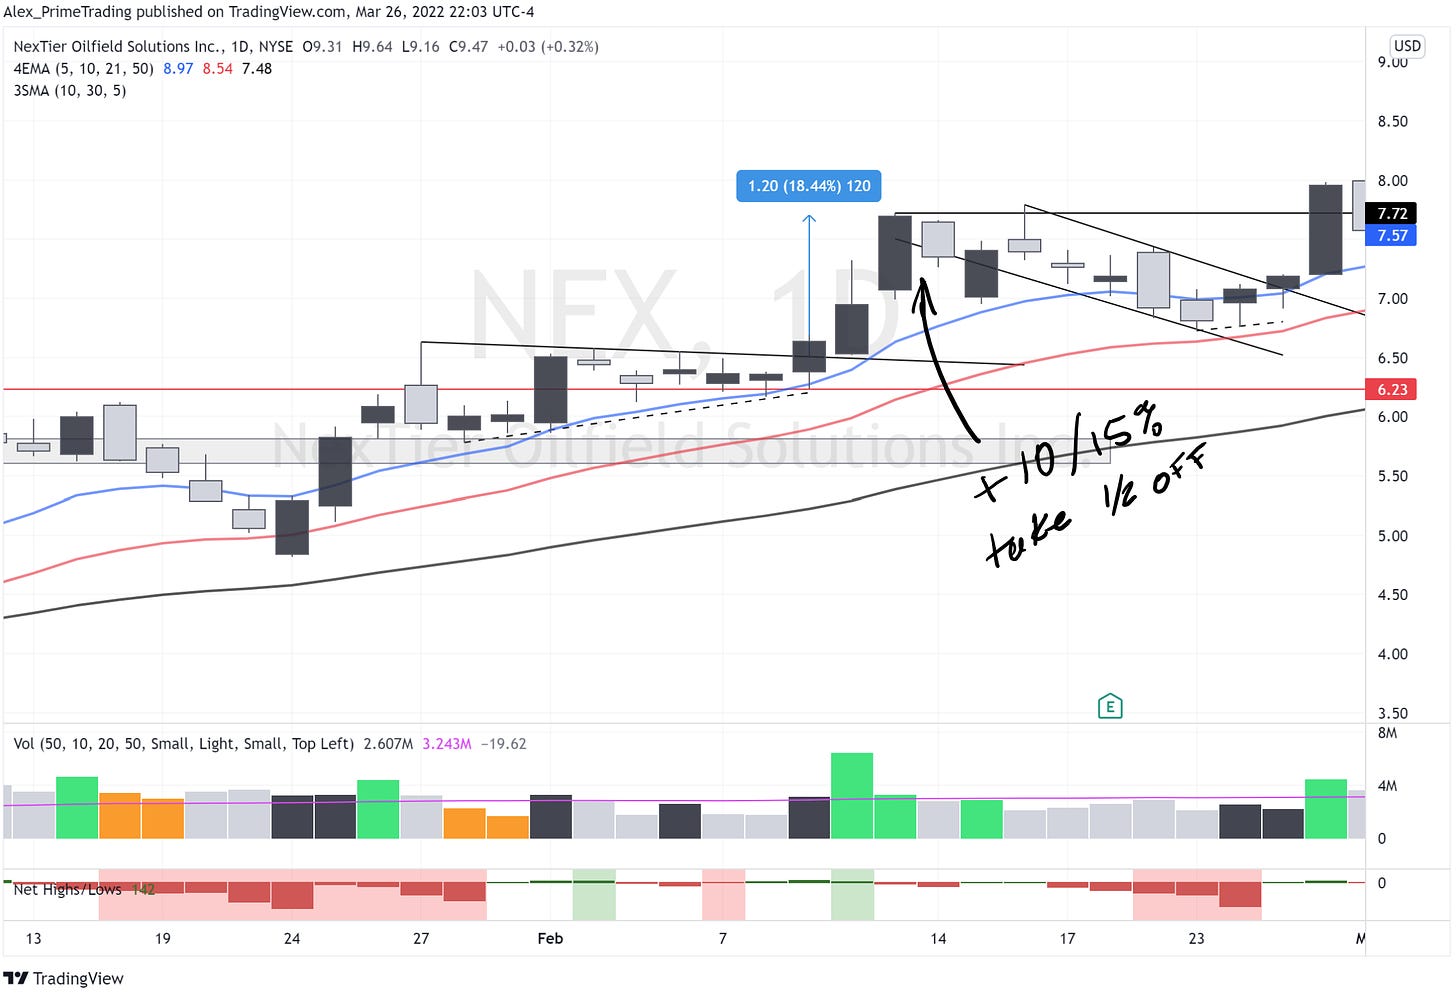
Specially since 2021, I like to SELL 1/2 position on strength during the initial move of the stock which tend to be from 2 to 5 days. As a rule of thumb, I like to take my first half trade out after an initial 10-15% initial move.
With NEX, the stock moved 18% in 2 days, so I SOLD 1/2 right on that second day. Don’t be greedy with that initial position.
This method is very powerful as it makes you instantly in the money for the trade whatever what happens next (almost). Even if the stock pullback to your SL, you make money. For me, mentally, this removes A LOT of stress to handle the trade once I sold that first half.
Let it Ride
You still have 1/2 position open after you sold into strength, so that’s where I like to switch to a position trader mindset. I want to give the stock enough room to work and catch a big triple digit gain over multiple months.
I am a firm believer that “Price Targets” are total BS and people that throw numbers around are even more clueless. You could be amazed at how far they can run a stock up…but you could also be amazed how strong they can crash a stock even if it’s an A+ company. For that reason, I want to let the stock “trend” until in doesn’t, and then I want to cut it on weakness. Innocent until proven guilty 🙂
To help me achieve that, I use a moving average system to help me determine when I’m gonna close the position.
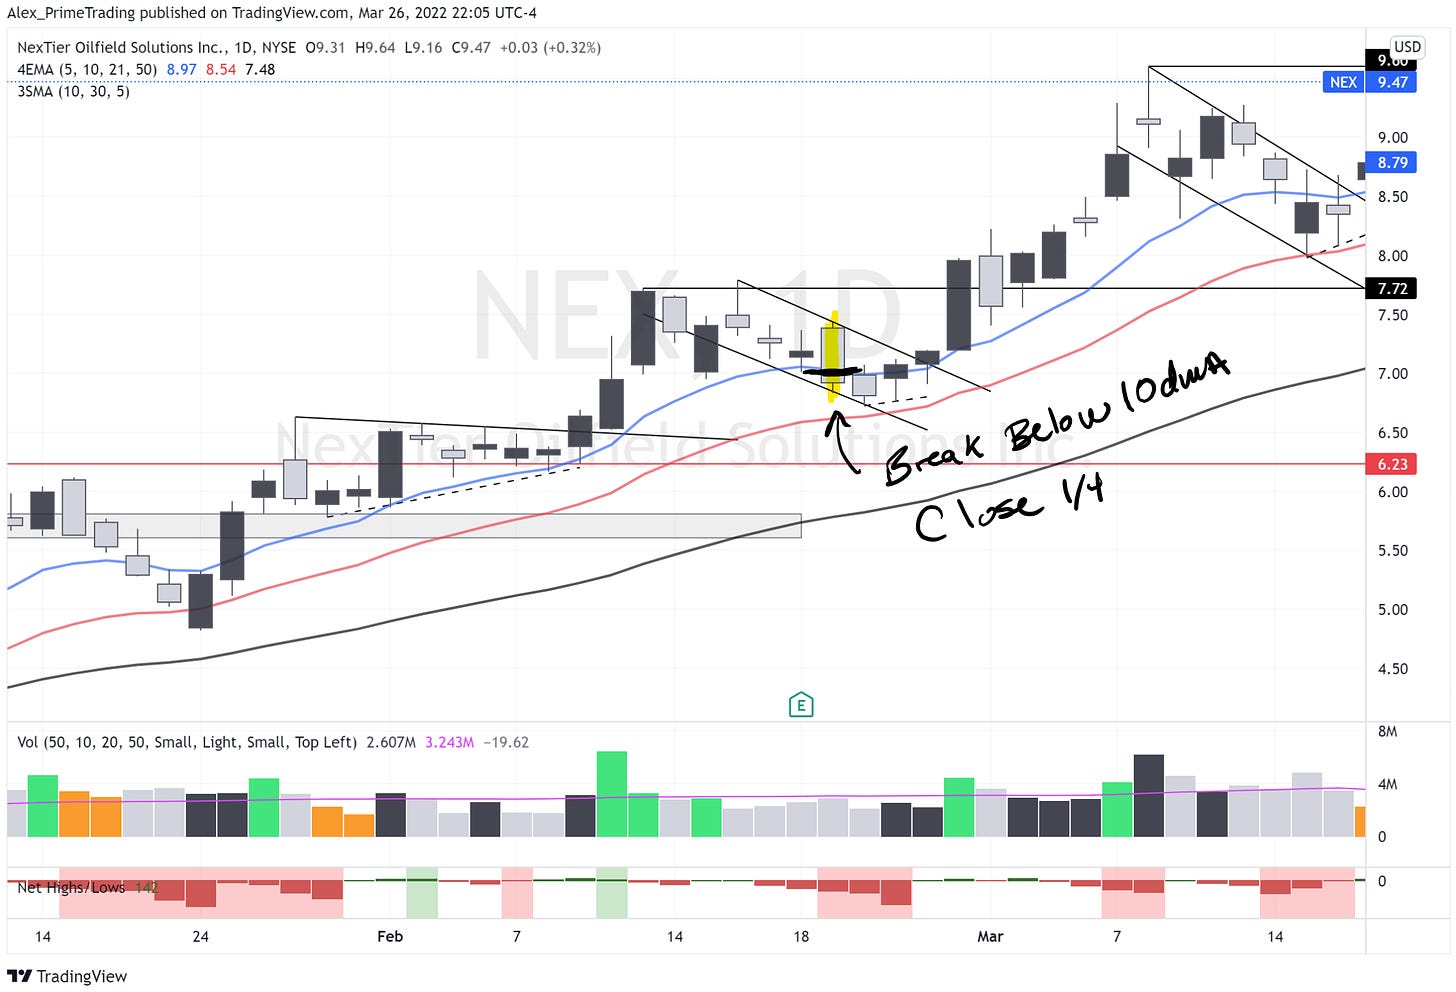
1- 1/4 position – Close below 10DMA
- That first “let it ride” part will be closed on a close below the 10dma.
- You want to wait at the end of the day to see if it’s not only a shakeout and they’ll buy the stock and close it above 10dma.
- Also, if we get a close below the MA but it’s a very tight & low volume day, I’ll probably wait for a second close below the 10dma before closing the trade.
2- Last 1/4 position – Close below 21DMA
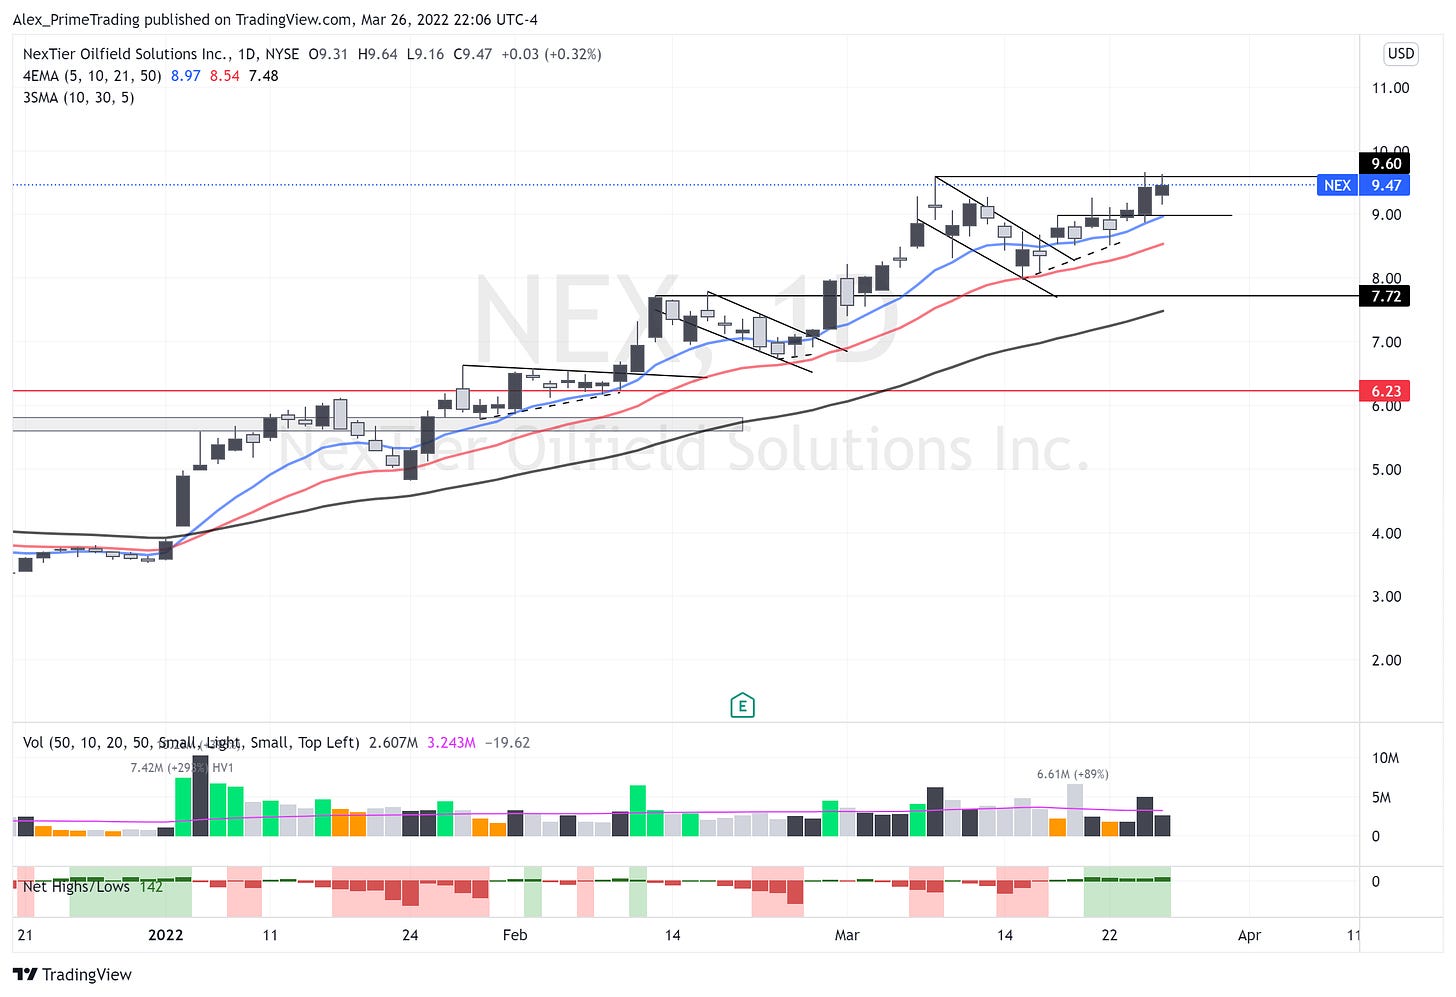
- The last part of the position will be closed at the break below 21dma.
- Same 2 rules applies for a potential shakeout of that level
See how last 1/4 position of that NEX trade would still be on with a nice 45% gain.
Note that you could use other moving average length. You could use the 21/50dma, 50/200dma depending on your personality & time horizon.
Takeaway
In this article, I showed you my own system for entry tactics & position management, however these rules might not fit your style or personality. You MUST have a system in place with specific rules that fits your personality, and that, you’ll have to experiment to find what fits you best.
Maximizing trading PROFITS through proper EXPOSURE 🪜
Like in sports, there are times to be aggressive, and times to be defensive. When the market is no good, you want to limit your exposure & action in order to limit the potential damages you do to your portfolio. Trust me, a couple of weeks of 2-5% drawdown quickly accumulate and you end up being in a 20-25% one before you realize it. You not only reduce your capital making it longer and tougher to get back to your equity ATH, but you also drain a lot of energy doing so and are not in an optimal mental state when the market really turns. You can still trade, but use smaller & fewer positions than you would normally do.
Determining you’re exposure should not be an ON/OFF process, you should view it as a dimmer switch where you increase progressively your risk based on the 3 methods I’ll be describing here.
MARKET-BASED EXPOSURE
First, you have to consider the general market condition. You want to trade while having the wind at your back. The vast majority of stocks move intrinsically with the market. Yes, you can pick a stock that is bucking the trend, but if you’re invested in 8-10 names and 100% exposure, you risk getting hurt more than anything else.
That’s why you want to determine if the general indices are in an uptrend, range, or a correction. To do that, I use the major moving averages & market structure to determine the market exposure I want to have at a precise moment.
Moving averages
Above 50dma
- 10dma > 21dma = 100% exposure (or more if margin)
- Price below 21dma = 75% exposure max
- 10dma < 21dma = 50% exposure max
Below 50dma
- 10dma < 21dma = 10% max (Normally day trades OR shorts)
- 10dma > 21dma = I begin to build exposure up to 50% if breadth confirms a move & we got a good sell-off extension
These are the rules that I use personally, the goal is to have a system, so feel free to develop your own rules around moving averages, market structures, or anything else. BUT, have a system.
Let’s use the current market environment and see how I handled market exposure during this period.
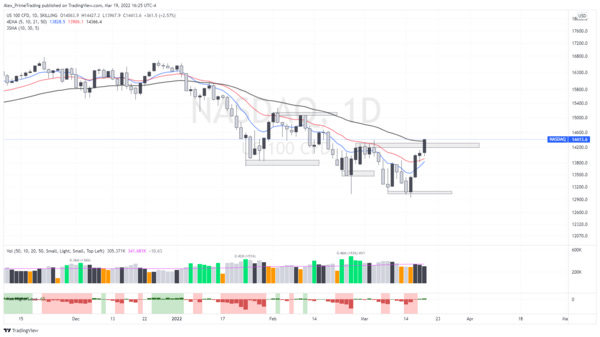
Since the early January 50dma break, I reduced my maximum exposure below 50%, and almost the entire time even below 25% due to the fact that we never closed above the 21dma during the entire correction.
Notice also the market structure, we have never been able to make a higher high since January and making lower lows on every leg down. It is only since Friday that we made 2 important moves, a close above the 50dma & also a higher high. While not being perfect, it tells me that we’re at a full risk-on environment based on my model.
I also use market breadth & structure to gauge if the rally has legs or not. We normally want to see a broad participation
Market breadth
- Net new high
- Stocks above 50dma & 200dma
- Advances/declines
- Sectors participation
- Etc..
Market structure
- Higher high / higher lows
- Lower highs / lower lows
PORTFOLIO-BASED EXPOSURE
Despite having a market-based exposure limit, you want to progressively increase your exposure in case the market pullback stops you at once on all your recently open positions. This kind of market action happens really often, that’s why you want to build your exposure gradually by using your recent trades gains to finance your next position risk.
Open heat risk
The first metric that I calculate is my current OPEN HEAT risk. This means that you sum up all the potential loss you would take if you would be stopped on all your positions at once.
OPEN HEAT (%) = (Current price – SL price) summed for all open positions / Total capital
I want to keep this open heat metric below 10% in order to manage risk properly if I were to be stopped out on all my positions.
You’ll understand that as your positions are making progress, you’ll be able to raise you’re stops based on market structure (subject for the next article :)), and then your open heat will decrease.
Progressive exposure
The second method I use here is a progressive exposure metric based on the profit I build in my current open positions. You want to use those profits to finance the risk of the next position. The goal is to protect you’re capital in case your positions are going against you.
Let’s use a basic example,
Trade #1 (1000$ position) :
Open profit = 2% = 20$
Trade #2 (1000$ position):
Risk (SL from potential entry) = 5% = 50$
In that case, you’re first trade profit IS NOT big enough to finance the 50$ risk you’ll take on your second position. You should then wait that your first position profit increases above 5% in order to finance that 2nd position risk.
You want then to calculate the overall open profit you have in all you’re positions, and determine the overall exposure you can go based on a fixed risk parameter. For me, I use a fixed 5% risk in order to calculate it.
The exact formula I use will be detailed in a future article & probably in the next version of my trading journal I’ll share soon with you folks.
PERFORMANCE-BASED EXPOSURE
Third, I also use performance-based rules to determine my ideal market exposure at any given moment. Regardless of the market condition, you also want to assess you’re current performance in case your trading is off for whatever reasons despite the market environment.
In contrast to Market & Portfolio-based exposure, I use my past performance to adjust my initial position size. In normal performance conditions, I take an initial 10% position while I’ll reduce that position size when I trade poorly.
Past performance
The first metric I use is the Risk-Reward Ratio for my last 20 trades. The RRR gives an indication of the expectancy of your current trading performance. A ratio above 1 is indicative of a positive expectancy while below 1 means you’ll lose money over time.
The formula to calculate RR is:
RRR = (Avrg Win % * Win rate) / (Avrg loss % * Loss rate)
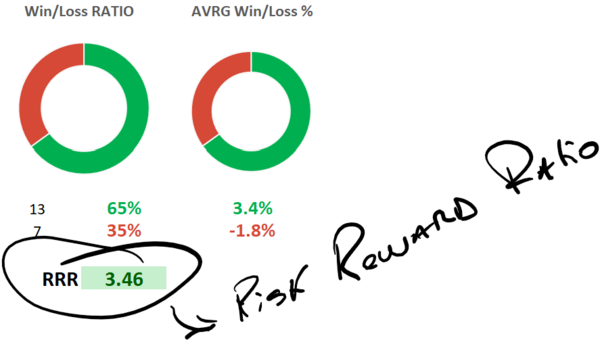
These are the rules I use to adjust my positions size based on current RRR:
RRR > 2 = Full 20% initial position
2 > RRR >1 = ½ initial position (10%)
RRR < 1 = ¼ initial position (5%)
Takeaway
While portfolio exposure is a complex concept, I firmly believe that in order to achieve above-average returns you need to have such a system put in place.
If you’re just beginning, you can start with 1 method at a time. Through time, you’ll be more comfortable and can add concepts/concepts one by one.

