Secular themes and trends are yet another area that investors must watch to understand long-term investment potential.
We constantly look for major shifts and themes that will take years or even decades to be played out. We then note the companies that are benefiting from these trends. When they begin showing explosive growth in earnings, our analysis is confirmed. We buy them, in most cases, when they meet our emerg-
ing trends and our selection criteria
That is where we can improve our odds of picking a really top winner—when a stock meets our growth, value, institutional, low debt, leading relative strength and earnings growth, strong balance sheet, bull market, and other criteria, and it also is benefiting from some of the emerging trends we foresee.
1910
Buggy makers and cigar stores.
1920
Aviation, oil, ice, and closed-end investment trusts.
1930
AT&T, higher yielding utilities, no-debt f inancials with earnings.
1950
Uranium, bowling chains.
1960
Conglomerates, recreational vehicles.
1970
Nifty fifty, OTC growth, oil, gold stocks.
1980
Junk bond promoters, REITs, Japanese stocks, discount distributors of goods, PC software, hardware, electronic supplies, pharmaceuticals.
1990
Medical, biotechnology, capital goods, software, telecommunications, communication software and hardware, health maintenance organizations (HMOs),
financials, emerging markets and debt, Internet companies, cigar manufacturers.
To understand investment trends, you need to understand basic economics and human nature.
The new high list of 52-week new highs for each country is also a good place to look for new themes. Serious investors should
always monitor the new high list. Whenever you find a number of stocks in a particular or new industry, that should be a wake-up
sign that something is happening in that industry or sector.
Is it a sustainable trend that will allow this sector or industry to continue being a top relative strength area? Is there fuel behind it?
The new high list is also a good area to watch for stocks that might meet our selection criteria
Two places to consistently locate excellent themes and trends are involved in these real-life examples: (1) the filling of technology
gaps as a technology is beginning to be implemented but not yet widely utilized; and (2) a company whose business lies in the
path of strong demographic trends.
The first example is one of the most profitable investments we ever made for funds we consult for: Cisco Systems, a company
that was filling a huge technology gap.
Once the Gulf War conflict was leading to an easy victory in early 1991, a new bull market emerged in stocks. The bond and
T-bill market moved above their respective 200-day moving averages in October 1990, while stocks followed in January 1991.
Shrewd investors began looking for companies experiencing rapid earnings growth. A little-known stock called Cisco Systems
met our criteria and intrigued us because it showed triple-digit earnings growth over the prior three quarters, and it was still rel-
atively undiscovered, having just gone public the year before. As we looked further back in Cisco’s history, we found that the com-
pany had actually experienced triple-digit quarterly earnings growth every quarter since late 1989! Certainly there had to be
one heck of a story here.
f you look over the past century of data, you will find that
each decade produces at least one bull move in stocks enough to
produce many “meteors” whose stock prices explode up 300 per-
cent or more in a one- to three-year period. These fad stocks start
out by showing strong consistent or turnaround earnings growth
(defined rigorously later in this chapter), then begin to take off in
price and become strong relative strength stocks as they are start-
ing to be discovered, and then in the final one third of their price
movement they become “darlings” of Wall Street and get wildly
overvalued and overowned by institutions prior to collapsing back
into relative obscurity and fairer valuations based on much slower
earnings growth. These are the meteors of the stock market.
However, you will also find historically, that each decade pro-
duces at least one bull move in which a handful of “fixed stars”
develop. Just like meteors, these fixed stars start out by showing
strong consistent or turnaround earnings growth (defined rigor-
ously later in this chapter), then begin to take off in price and be-
come strong relative strength stocks as they are starting to be
discovered, and often also become popular with the Wall Street
crowd. Fixed stars may become overvalued, but very rarely be-
come wildly overvalued. What really differentiates fixed stars is
that while their earnings growth slows some, they are still able to
produce more than 40 percent annual earnings growth for over a
decade. Because of their continued strong growth and lack of high
overvaluation, these stocks do not collapse, they just begin to
move up with more volatility and at a slower rate than their initial
prepopularity phase.
- Hunt for strong earnings growth and runaway characteris-
tics (both of which we will be describing specifically ahead)
in stocks Wall Street hasn’t yet completely discovered.
- Trade these stocks (rather than invest, buy, and hold) using
limited risk pattern recognition strategies for entry/exit/OPS
(Open Protective Stop), and get out (at least partially) when
institutions begin to dominate trading in the stock.
- Take partial profits when these stocks begin to get slightly
overvalued and then tighten up trailing stops and look to
exit completely on the first sign of serious weakness.
Criteria for Runaway up Stocks with Fuel
Technical Strength. This means that the stock has exhibited run-
away characteristics via our 5/21 method at some point since the
trend in question began. It also means the stock has not fallen below
its 200-day moving average (MA) once its trend has begun and it has
moved above the 200 MA. Finally the stock must have an O’Neil’s
Relative Strength rank of at least 65 if it is undergoing a correction, and
at least 80 if it is making new highs. This ranking is available from
Investor’s Business Daily or Daily Graphs.
Consistent Growth or Turnaround Growth. Consistent growth means
(1) the stock has a five-year annual growth rate of 25 percent or
higher; and (2) three years of higher annual earnings or two years
of higher annual earnings and a next year’s estimate of higher
earnings than the current year. OR
Turnaround growth means (1) the last two reported quarterly
earnings showed earnings up 70 percent or more over year-earlier
same quarters, and (2) this quarter’s earnings are above last quar-
ter’s earnings.
Strong Quarterly Earnings Growth, Earnings Momentum, and Top Earn-
ing Per Share (EPS) Ranking. Strong quarterly earnings growth
means that both this quarter and the last quarter show earnings up
25 percent or more over year-earlier similar quarters. AND
Earnings momentum means that either this quarter’s earn-
ings are higher than last quarter’s earnings or that this quarter’s
earnings are up over year-earlier similar quarter by a higher
percentage than last quarter’s earnings were up versus last quar-
ter’s year-earlier similar quarter. Put simply, this quarter’s earn-
ings growth rate is higher than last quarter’s earnings growth
rate. AND
Top EPS rank means an Investor’s Business Daily or Daily Graphs
EPS ranks over 80.
Reasonable Price. Criteria are:
- P/E is 70 percent or less of the lessor of (a) a stock’s five-
year growth rate (unless the stock is a turnaround growth
pick and not a consistent growth pick, in which place the
growth rate criterion here does not apply), or (b) the lower
of the quarterly earnings growth rate of the last two quar-
ters; or the P/E is 50 percent or less of the stock’s antici-
pated growth rate of the next year via analysts consensus
estimates. AND
- P/E is not twice the S&P’s P/E or greater. AND
- Price/Sales is not > 6.
The bottom line for this criterion is that the stock is not
overpriced (items 2 and 3), and that it is selling at a dis-
count to either its current growth or its expected growth
rate.
Relatively Undiscovered Stock.
The combined (bank and fund) insti-
tutional sponsorship of the stock should be ideally less than 16 percent of
capitalization. If a stock meets strong themes and trends one can buy
it until institutional sponsorship reaches 35 percent, but don’t add
to it thereafter. In addition, investors should begin taking profits
once a stock reaches 40 percent or higher institutional sponsor-
ship. These figures are to be found in O ‘Nell’s Daily Graphs, and in
the charts of Investor’s Business Daily.
Low Debt. The strongest companies use their own internal growth
to finance their expansion. This means long-term debt less than 50
percent, actually less than 10 percent in most top stocks. You can
relax this qualifying criterion only in specific instances. The two
main such situations are when you are trying to exploit a clear sec-
ular theme or trend and none of the stocks in that industry meet
our criteria but there are one or more that meet all the criteria but
low debt. The second instance is when all the companies of the in-
dustry in which a stock competes have very high debt levels; in
some industries even the best companies need high debt.
Positive Fundamentals and Ratings. Positive fundamentals means
that there is a simple, straightforward reason to expect continued
earnings growth such as a new product, a technology gap being
exploited and not yet fully in use by its expected market, a change
in management and anticipated results from restructuring, demo-
graphic trends expanding the market, or changes in interest rates
or economic environment. You should be able to explain to an un-
interested party in plain language why the stock should continue
to experience sharp earnings growth for the next few years.
Positive ratings means that if the stock is followed by premier
stock rating services such as Value Line, Zachs, or Lowry’s that it
has a top or second-to-top rank in most of them and does not have
a less than average rank by any of them. You do not need to sub-
scribe to all these services, but you should probably subscribe to
one of them or else get our own Portfolio Strategy Letter, which
screens stocks in this way for you.
Maintenance of Acceptable Risk. Cut risk to original capital and
overall risk once any potential problems develop in each market
and stock. In our money management rules, you will normally
risk up to 2 percent of capital on each position from entry to OPS.
If there is any reason for caution, however, you should cut new risk
to 1 percent on any new positions or additions. Reasons for cau-
tion include (1) the stock itself does not meet new buy criteria be-
cause it is no longer reasonably priced or no longer undiscovered;
(2) the overall country market that the stock is based in is becom-
ing overvalued or technically questionable, or interest rate trends
are no longer clear; (3) top timing models such as the Chartist or In-
ternational Bank Credit Analyst are cautious or negative on that
overall market; and (4) the stock is a takeover rumor or takeover
target where the investor doesn’t have inside information.
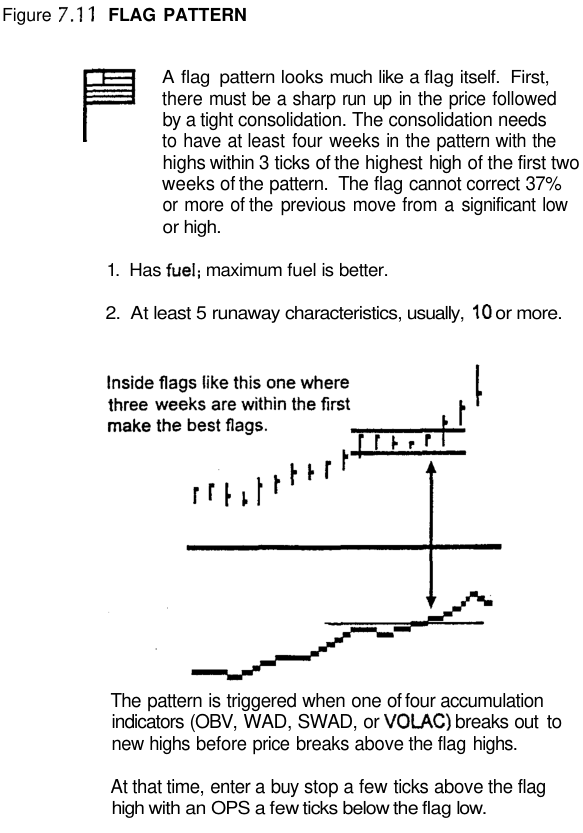
Volume Accumulation Indicators Used in Chart Patterns
• On-Balance Volume (OBV). OBV starts at zero and adds total
volume to a cumulative total each day that closes higher
than the previous day, and subtracts total volume each day
hat closes lower than the previous day. Add volume each
day that closes higher, subtract volume that closes lower,
and keep a cumulative total.