My first order of business when I log in is to weed through my scans and assess how things might go for the day and look for potential opportunities.
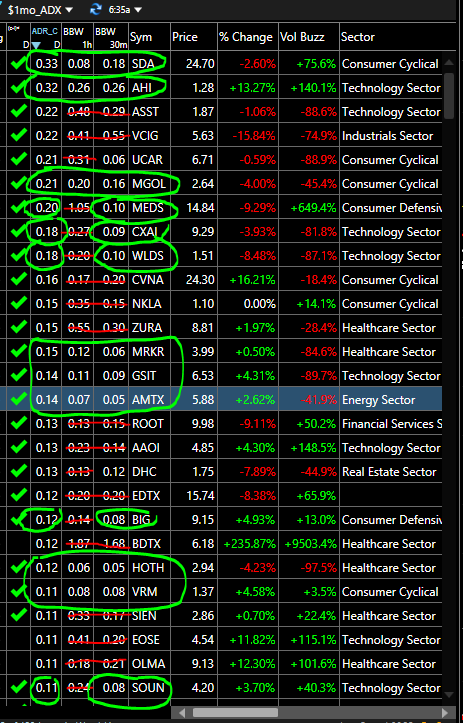
While I don’t always know which stock I’ll end up trading, what I do know automatically is which stocks I won’t trade. If the ADR (1st column) is less than the 1hr and/or 30min BBW, I just scratch it out of my mind immediately. Those stocks are already starting the day too wide and too loose, throwing my demand for asymmetric R/R off. What’s left are stocks whose ADR is greater than the 60/30min BBW.
If the ADR is greater than the 60min, then that usually indicates to me a 3-5 day consolidation and if the ADR is greater than the 30min, that indicates a 1-2 day consolidation. If the ADR is greater than both, those are typically the best situations to launch from. Just because something is circled doesn’t make it an automatic buy – there’s still some discretion and further scrutiny applied, but it helps me whittle things down quickly.
This is a bit complicated to explain (and we’re already several hours into the session), but when I’m looking at my scans right after the open, I’m looking for several key things:
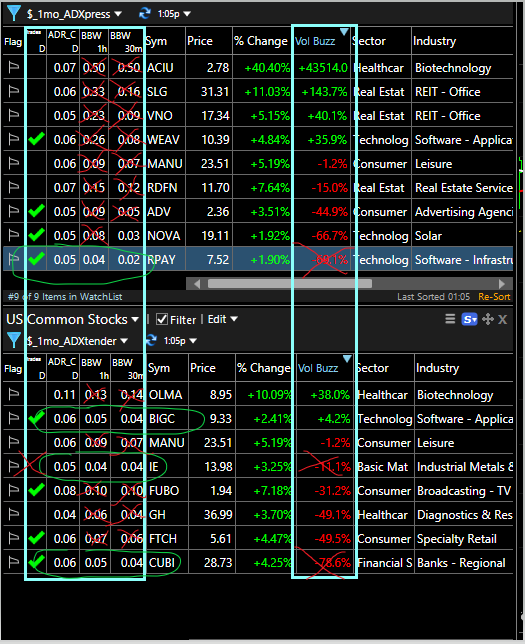
1) The fact that it’s even in my scan means it’s breaking through the upper bollingerband, which is the first thing bringing it to my attention.
2) Next, I want the 20-day ADR to be greater than the 1h or 30m bollingerband width. In other words, I want the intraday BBW to be compressed relative to the stock’s normal volatility. If the BBW is greater than the ADR, then I know it’s too loose and I can usually skip it.
3) Then, I want the volume buzz to be showing strong volume – preferably as high as possible or at least not limp dicking along. Strong volume tends to lead to strong moves.
4) I want a green checkmark in the “tradeable” column. That tells me the stock is not up more than it’s average daily range yet. No checkmark, I usually pass on it, since the reward to risk math is now off.
Sometimes, the stock is tight and compressed, but the volume is limp. Usually a pass. Sometimes the stock is compressed, breaking out, but no green check mark. Darn looks like I missed it.
What this does for me is it removes my attention from bullshit that I don’t care about and it focuses my attention on things I need to be caring about. It helps me sift through the thousands of stocks in the mkt and key in on the ones that are actionable now. If nothing meets my criteria, I do nothing. If there are a bunch of things meeting my criteria, then I’ll have to use further selection criteria to weed down the list – maybe looking at sector/industry. But I can’t underestimate how important this process is for me to narrow my focus and streamline my processes – that way I’m in execution mode, rather than trying to think about 50 different things.
My primary entry tactic is a Bollinger Band Compression (BBC) breakout. There’s nothing I want more than to have BBCs exploding all around me.
I believe in two fundamental tendencies of market action: a trend in motion tends to stay in motion and stocks go through periods of expansion and contraction or mean reversion.
Three main parts:
a) Strong uptrend (expansion)
b) Correction (compression)
c) Entry on resumption of the trend (expansion)
I’m following the same principles that Dave Landry, Qullamaggie, and all these other traders follow – I just use my own unique tactics to execute the trades. It’s the same shit though.
Do I use the 60 min? 30 min, 15 min? I use them all – there are trade-offs and pros and cons with each.
How much compression? I want the Bollingerband to be compressed to less than the stock’s 20-day average daily range – preferably much less. A compression on the 60min chart looks like a 3-5 day tight range. A compression on the 30min chart looks like 1-2 day tight range. If you are trying to implement this, I would start with the higher intraday timeframes like the 60 or 30 min. Starting with 15 or 5 mins without understanding the nuances and trade-offs is asking for trouble.
Where does the stop go? Why, the lower bollingerband. Or use the low of the day or the trailing 10EMA or some kind of n*ATR trail. Just be consistent so you learn the trade-offs and pros/cons. There are no perfect methods – there are tradeoffs between optimal, efficient, and what you can do psychologically. These are not the same.
If I have 20 stocks coming through my primary scan, how do I get down to the few that I actually trade?
Which ones have the highest volume buzz and price expansion at the pivot?
Which ones have the tightest consolidation and most constructive setup?
Which ones belong to the currently hot sector or theme?
Some days there are a lot of stocks that might meet these criteria, even after applying the above. That’s when I have to restrain myself from being a kid in a candy store. You can’t trade them all and eventually you run out of capital. There are worse things in the world than to have so many stocks going in your favor that you’re maxed out.
The key things I care about when selecting specific stocks to buy:
1) Volume and price expansion – I want to see powerful volume and price action at the pivot – no limp dicks (sorry to those with ED problems)
2) I want compression before the breakout – at a minimum, I want the 15m BBW to be less than the stocks ADR for 1-3 day pauses or the 60m BBW to be less than the ADR for 3-5 day pauses. If it’s sloppy and loose, then I’m not interested.
3) I need a solid reward to risk situation – asymmetric opportunities – where I enter and place my stop has to give me an advantage mathematically. If the ADR is 6% and my stop is 10%, that makes zero sense.
3) I prefer mid and small cap tech – I skip most biotechs unless they have some kind of fundamentals (which is rare) – but I try to determine the theme the mkt is pushing higher
4) Mkt context – the better breadth and trend are, the higher my odds are – my aggressiveness is directly linked to my feelings of mkt context and how well my positions are progressing
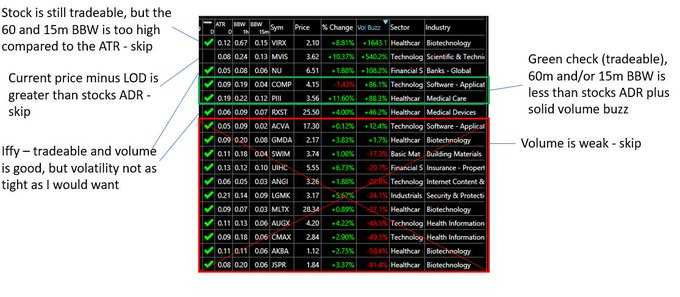
Column 1 – green check means the current price minus the low is less than the ADR – means it’s still tradeable
Column 2 – shows the 20-day ADR
Column 3/4 – shows the 60 and 15 min BB width
In a previous tweet, I published my four main scanning criteria to whittle the 6,000+ universe of stocks in TC2000 down to a manageable list of 200 or so. Out of this 200 or so, what is my “call to action” to get in?
I’m looking for specific expansion criteria – namely, I want the stock to be breaking above a “range” – a cluster of 3-5 days or so of tight, orderly consolidation somewhere in the vicinity of the 10 or 20 (sometimes the 50) EMA. I want this bar to be the biggest bar in the last 5 or 10 sessions and preferably I want volume to come in heavy.
Specifically, I add c/c1>1.03 and c>h1 and c>h2 and ((h-l)>.5*(avgh5-avgl5)) and ((c-l)<(avgh20-avgl20)*1.5) as a breakout scan formula – I want the stock to be up at least 3% and be above the most recent two highs – and I want the bar to be at least half as big as the avg of the last 5 bars, but not bigger than 1.5 times the avg of the last 20. That puts the bar in the middle ground of potentially outpacing recent price action, but not so big that it throws off the reward/risk. Since I mostly trade the first hour, I use a combination of price expansion and volume expansion (using volume buzz) to position myself into stocks that are potentially breaking out, early in the session, as they break out of sound patterns.
I also want the stock to be trading near the 10/20 EMA – so I add that the stock needs to be no more than 2times it’s ATR away from the 20-day and the low to be no more than .5 ATR from the 10-day
maxh3<(xavgc20 + 2*(avgh10-avgl10))
l< (xavgc10 + (.5*(avgh10-avgl10)))
I have a separate scan for Gaps (since these last two would eliminate any gapping stocks).
Four basic scan criteria:
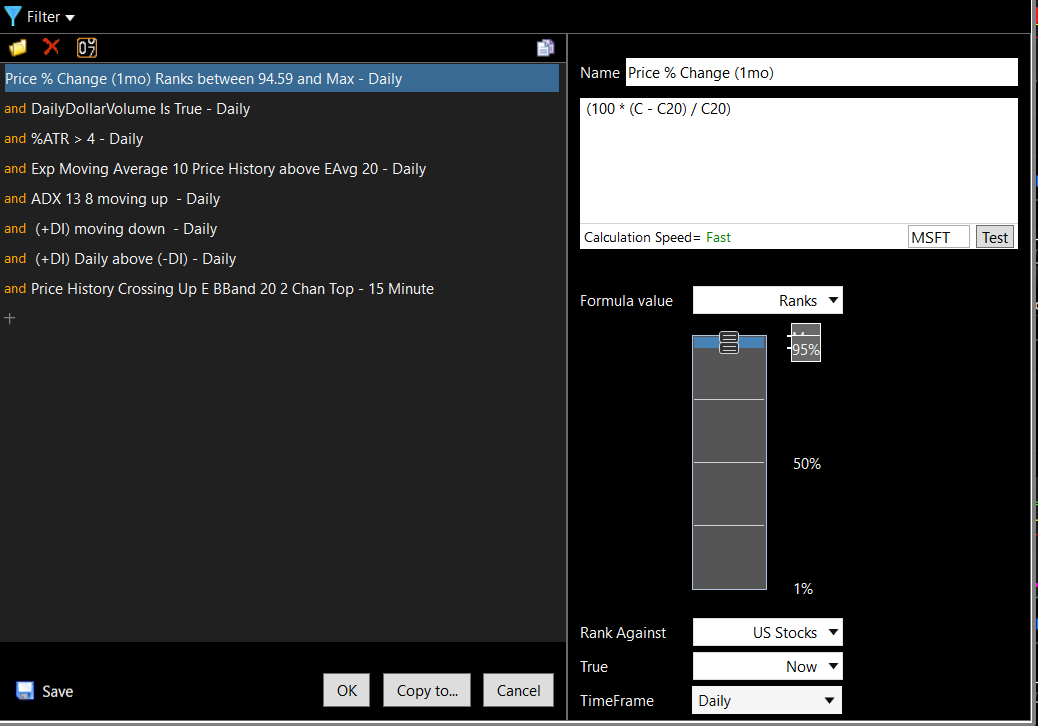
1) RS – (100 * (C – C20) / C20) ranked 90 or higher (for 1 month – can use 60 or 120 for 3 or 6 month)
2) Liquidity – avgv20>300000 and c>1
3) Volatility – (((AVGH20 – AVGL20) / 2 + (ABS(H – C1) + ABS(C1 – L) + ABS(H1 – C2) + ABS(C2 – L1) + ABS(H2 – C3) + ABS(C3 – L2) + ABS(H3 – C4) + ABS(C4 – L3) + ABS(H4 – C5) + ABS(C5 – L4) + ABS(H5 – C6) + ABS(C6 – L5) + ABS(H6 – C7) + ABS(C7 – L6) + ABS(H7 – C8) + ABS(C8 – L7) + ABS(H8 – C9) + ABS(C9 – L8) + ABS(H9 – C10) + ABS(C10 – L9) + ABS(H10 – C11) + ABS(C11 – L10) + ABS(H11 – C12) + ABS(C12 – L11) + ABS(H12 – C13) + ABS(C13 – L12) + ABS(H13 – C14) + ABS(C14 – L13) + ABS(H14 – C15) + ABS(C15 – L14) + ABS(H15 – C16) + ABS(C16 – L15) + ABS(H16 – C17) + ABS(C17 – L16) + ABS(H17 – C18) + ABS(C18 – L17) + ABS(H18 – C19) + ABS(C19 – L18) + ABS(H19 – C20) + ABS(C20 – L19)) / 40) / C) >.04
4) Trend – xavgc10>xavgc20