
Thomas Carr: 3 Keys To Momentum Trading
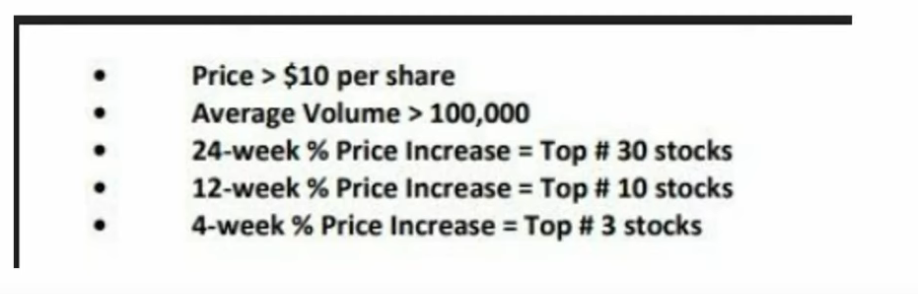
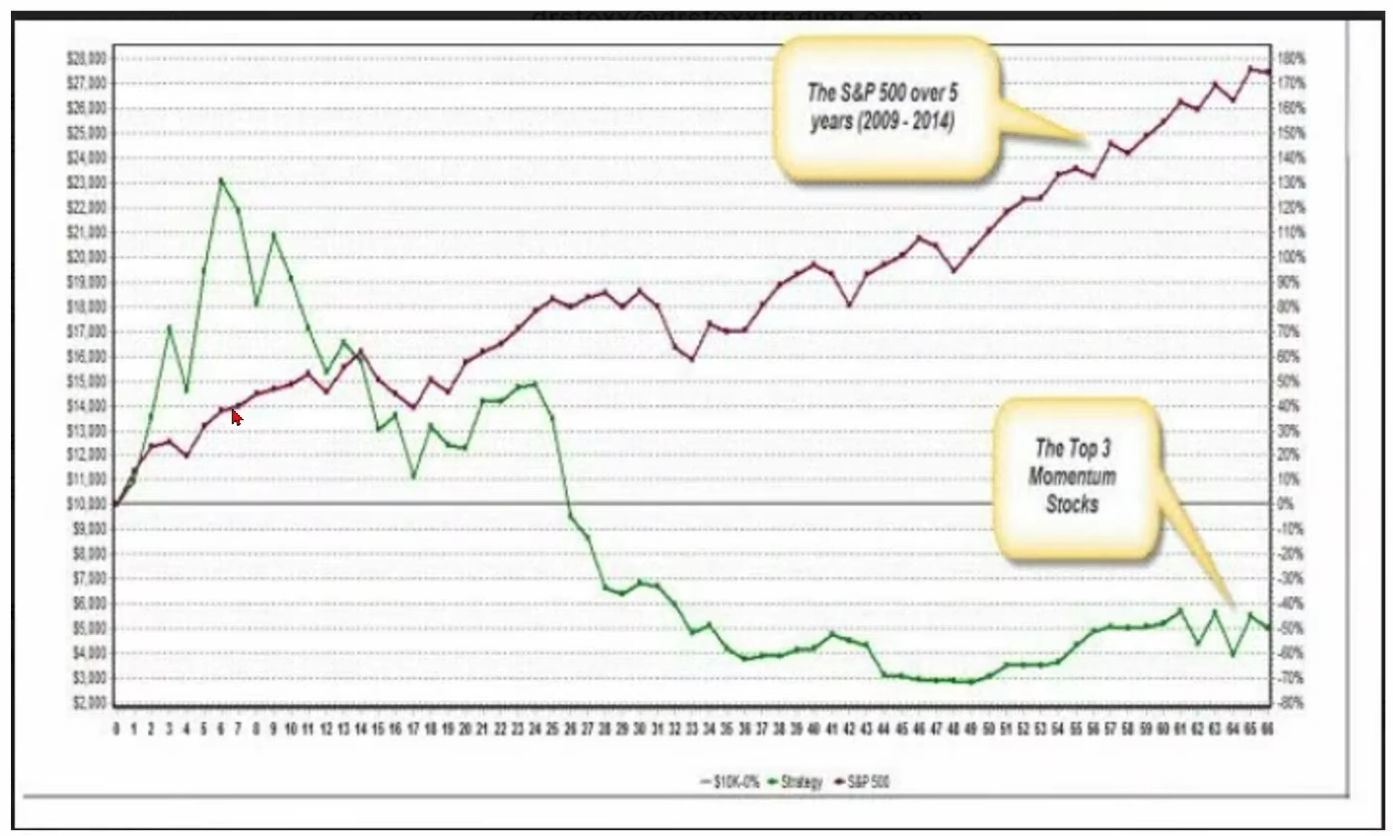
Notes on Momentum stocks parameter
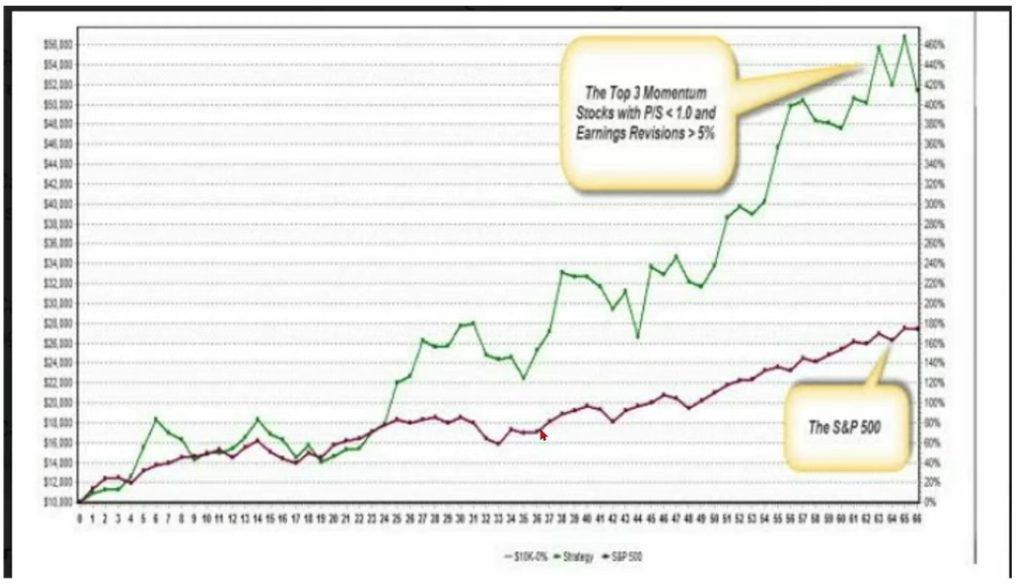
Adding P/S < 1.0 parameter

Adding Earnings Revisions >5% parameter
% Change Q1 Estimates over 4 weeks > 0
This means we’re looking for positive current quarter
estimate revisions over the last 4 weeks.
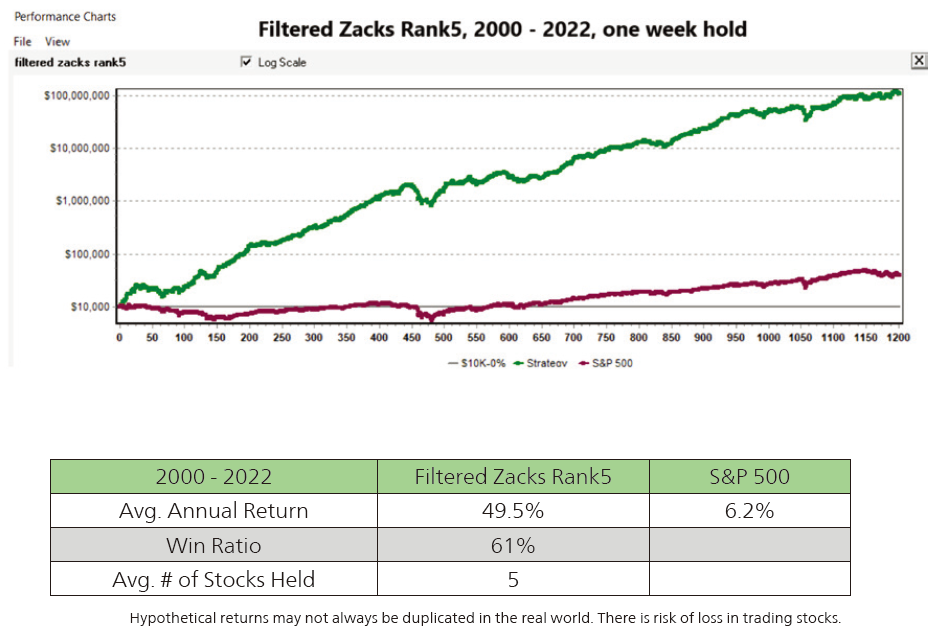
Adding Broker ratings parameter
% Broker Rating Change over 4 Weeks = Top #5
Top five stocks with the best average broker rating changes (upgrades) over the last four
weeks.

Parameters:
Price/Sales Ratio <= .5
A low Price to Sales (P/S) ratio is typically considered a good bargain, since the investor is
paying less for each unit of sales. Another way of looking at this is that a P/S ratio of 1 means
the investor is paying $1 for each $1 in sales the company makes. A P/S ratio of .5 means you’re
paying 50 cents for each $1 in sales the company makes. And paying less than a dollar for a
dollar’s worth of something is a bargain.
% Change Q1 Estimates over the last 4 weeks >= 0
(Only earnings with fresh upward revisions for the current quarter, or at the very least no downward
revisions, qualify. This is one of the most important filters and one of the reasons why this screen is called
Upgrades and Revisions.)
Average Broker Rating < 2
This includes Strong Buys and varying degrees of ‘average’ Strong Buys. Since broker ratings
are typically skewed to the ‘bullish’ side, I want to make sure my picks have strong outlooks
from the analysts covering them.
% Change in Price over 24 weeks – Top # 20
Looking for the top 20 price performers out of the list of stocks that qualify the above
parameters.
% Change in Price over 12 weeks – Top # 10
Looking for the top 10 price performers out of the list of the 20 best from above.
% Change in Price over 4 weeks – Top # 3
Looking for the 3 best price gainers out of the top 10 list from above.
Current Price/52-Week High >= .80
Stocks that are either at a new 52-week high, or have just hit it and are still trading within 20%
of it, or are climbing towards their 52-week high and are within a 20% striking distance.
Projected One Year EPS Growth F(1)/F(0) >= Industry Median
While the P/S and P/E ratios searched for stocks with valuations below their Industry’s median,
this item is looking for stocks with projected growth rates above the median for its Industry. In
order for a stock to continue to go higher, there needs to be a reason for it to do so. And strong
growth of course is an important part of that.
(% Rating Change over 1 Week) + (% Change Q1 Estimate over 4 Weeks) + (%
Change F1 Estimate over 4 Weeks) = Top # 7
This calculated expression (i621 + i44 + i54) combines three items together because of their
predictive performance. Stocks with positive broker rating changes (broker rating upgrades)
outperform those with broker rating downgrades, and those with no broker rating change at
all. And stocks with upward earnings estimate revisions tend to receive more upward earnings
estimate revisions, which often leads to higher prices. Using the current quarter and the current
year shows increased optimism for both the short-term and the longer-term. Only the 7 stocks
with the highest scores for all three items
% Change Actual EPS (F0)/(F-1) >= 0
(In addition to the 5 yr. historical growth rate, we’re also looking for positive EPS growth over this last year
as well. (F0) being the last completed year and (F-1) being the year before the last completed year.)
% Change Actual EPS (Q0)/(Q-1) >= 0
(We’re also looking for positive EPS growth last quarter over the one before that -– (Q0) being the last
completed quarter and (Q-1) being the quarter before the last completed quarter.)
% Change Actual EPS (Q-1)/(Q-2) >= 0
(Positive EPS growth for the quarter over quarter period before the last completed quarter. (Q-1) over
(Q-2).
In short, the above two expressions demand two quarters of positive EPS growth.
And as a whole, the 5 yr., 1 yr. and last 2 quarters of EPS growth paint a solid earnings picture over the
longer term historical and most recent historical past.
Last EPS Surprise >= 0
(The more likely a company has surprised in the
past, the more likely they are to surprise in the
future. This is true for both positive and negative
surprises. So no negative surprises allowed.)
